Infrared Spectroscopy of Polymers
One of the most common and effective methods for polymer analysis is Fourier Transform Infrared Spectroscopy (FTIR).FTIR is based on the principle that molecules vibrate at specific frequencies when they are exposed to infrared light. These vibrations depend on the type of bonds, functional groups, and molecular structure of the material. Some frequencies are absorbed by the material while others are transmitted or reflected. By measuring the intensity of the transmitted or reflected light at different frequencies, an FTIR spectrometer can generate a spectrum that shows the characteristic absorption peaks of the material.
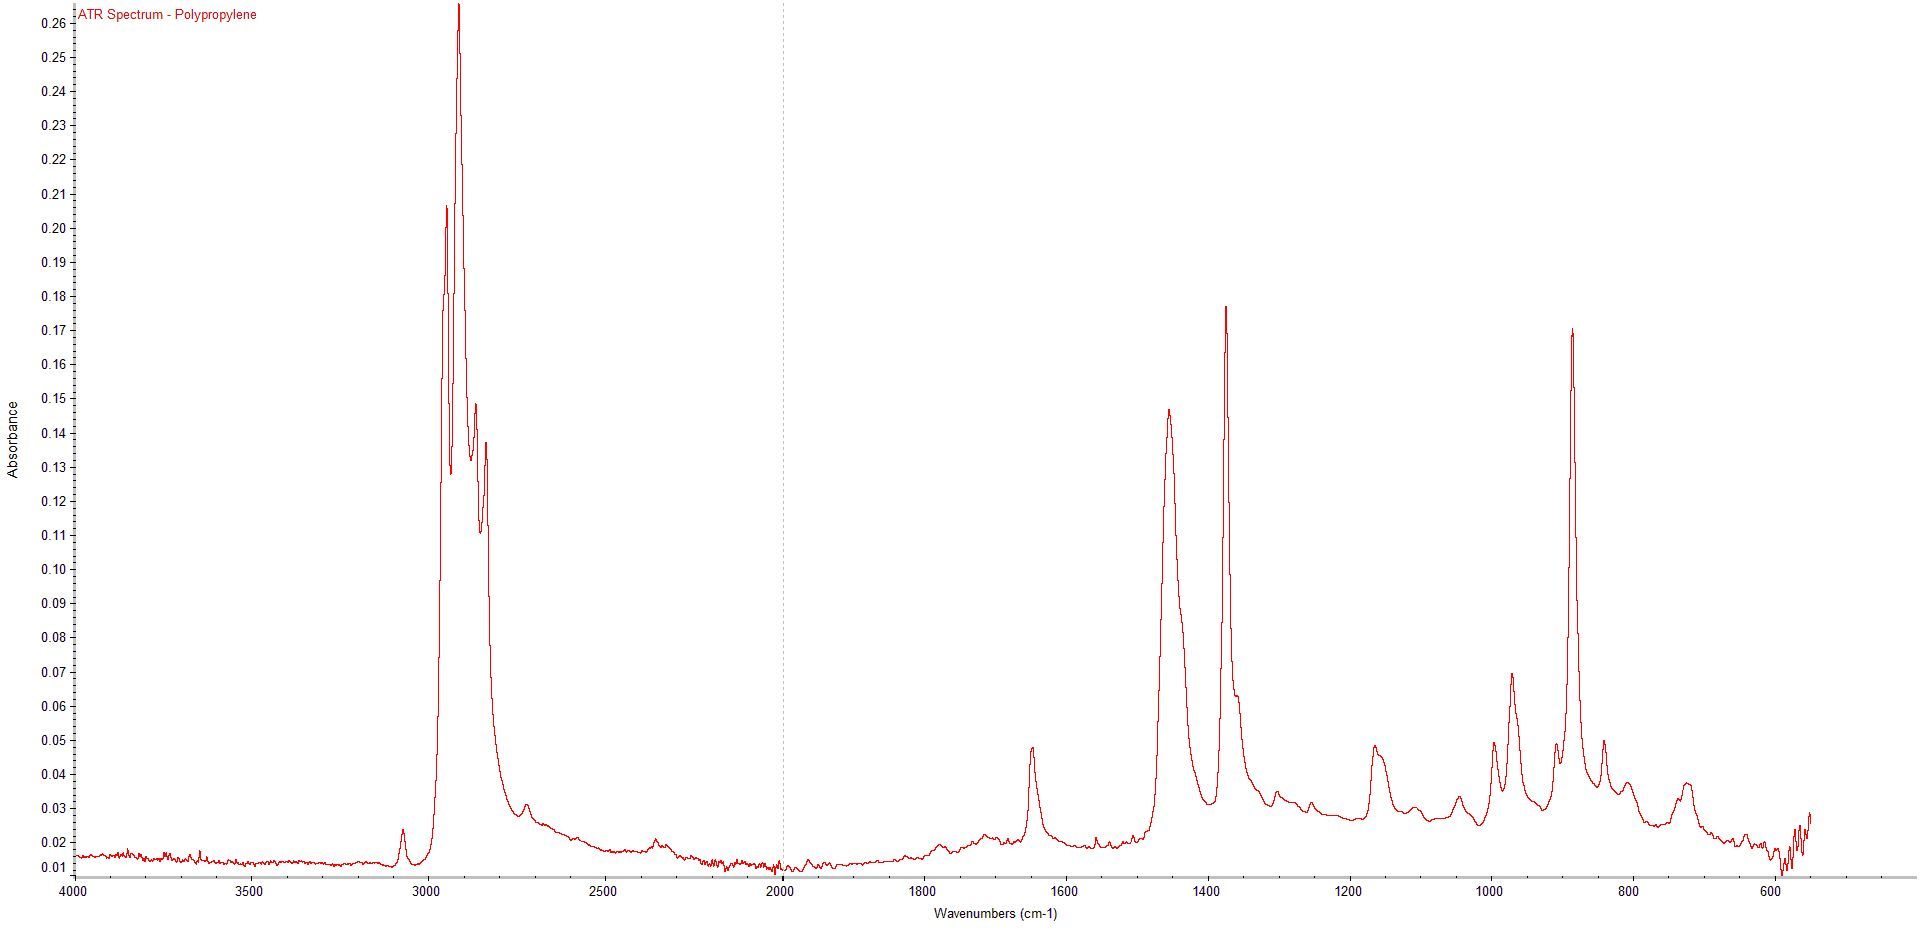
The spectrum can then be compared with reference spectra from known materials or databases to identify the polymer and detect major additives, secondary polymers or contaminants present.
We can record spectra in reflectance from the polymer surface or by transmission through a thin film or section of material. Where necessary, we can use an infrared microscope to record spectra from tiny inclusions, gels, foreign bodies or to scan across sections of laminates or multi-layer components.
Case Study - Infrared Spectroscopy of CPVC Pipe Sample
Following the brittle fracture of a CPVC pipe leading to in-service failure, ipolytech used a number of FT-IR techniques to support the investigation.
Initially, infrared spectra were recorded from a new, unused section of pipe. Both internal and external surfaces were analysed by attenuated total reflectance using a diamond ATR sampling accessory. This provides a sampling area of approximately 5 mm x 5 mm.
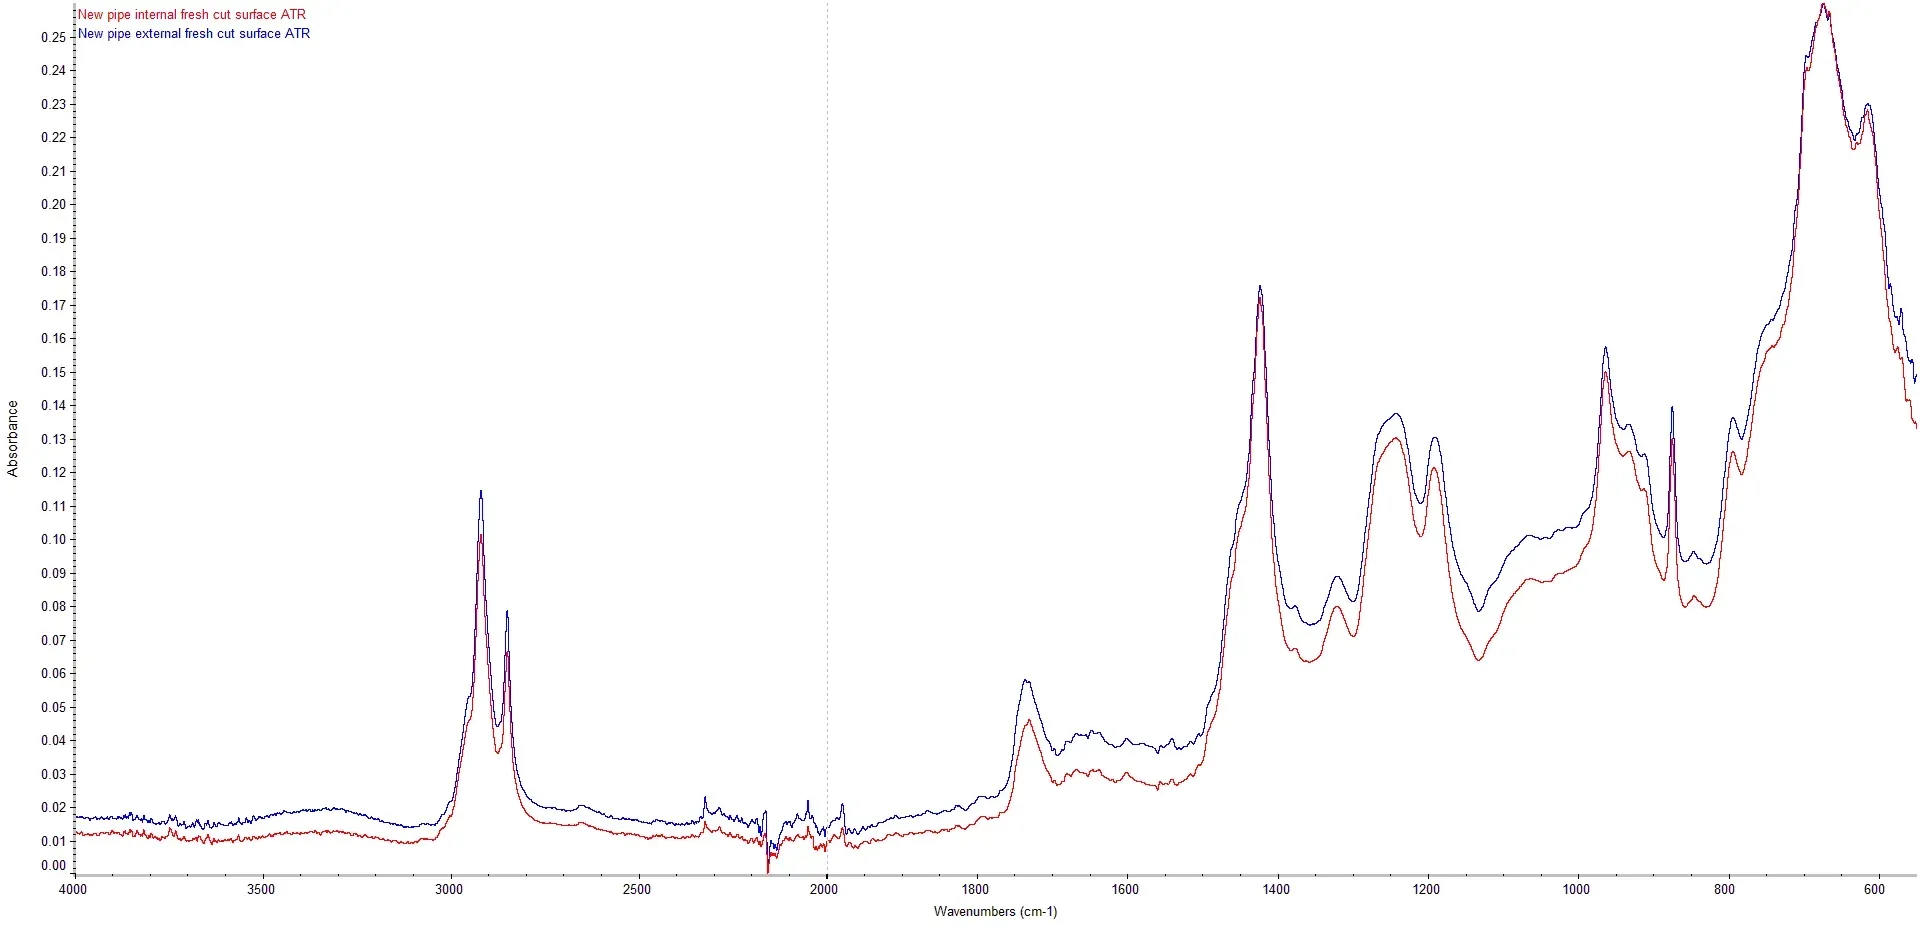
ATR Spectra from Internal and External Surface of New CPVC Pipe
The spectra show characteristic absorption bands associated with a PVC/cPVC material. Also apparent is a strong absorption circa 875 cm-1 which is characteristic of the presence of calcium carbonate within the CPVC formulation and bands at around 965cm-1 and 912 cm-1 consistent with a butadiene impact modifier.
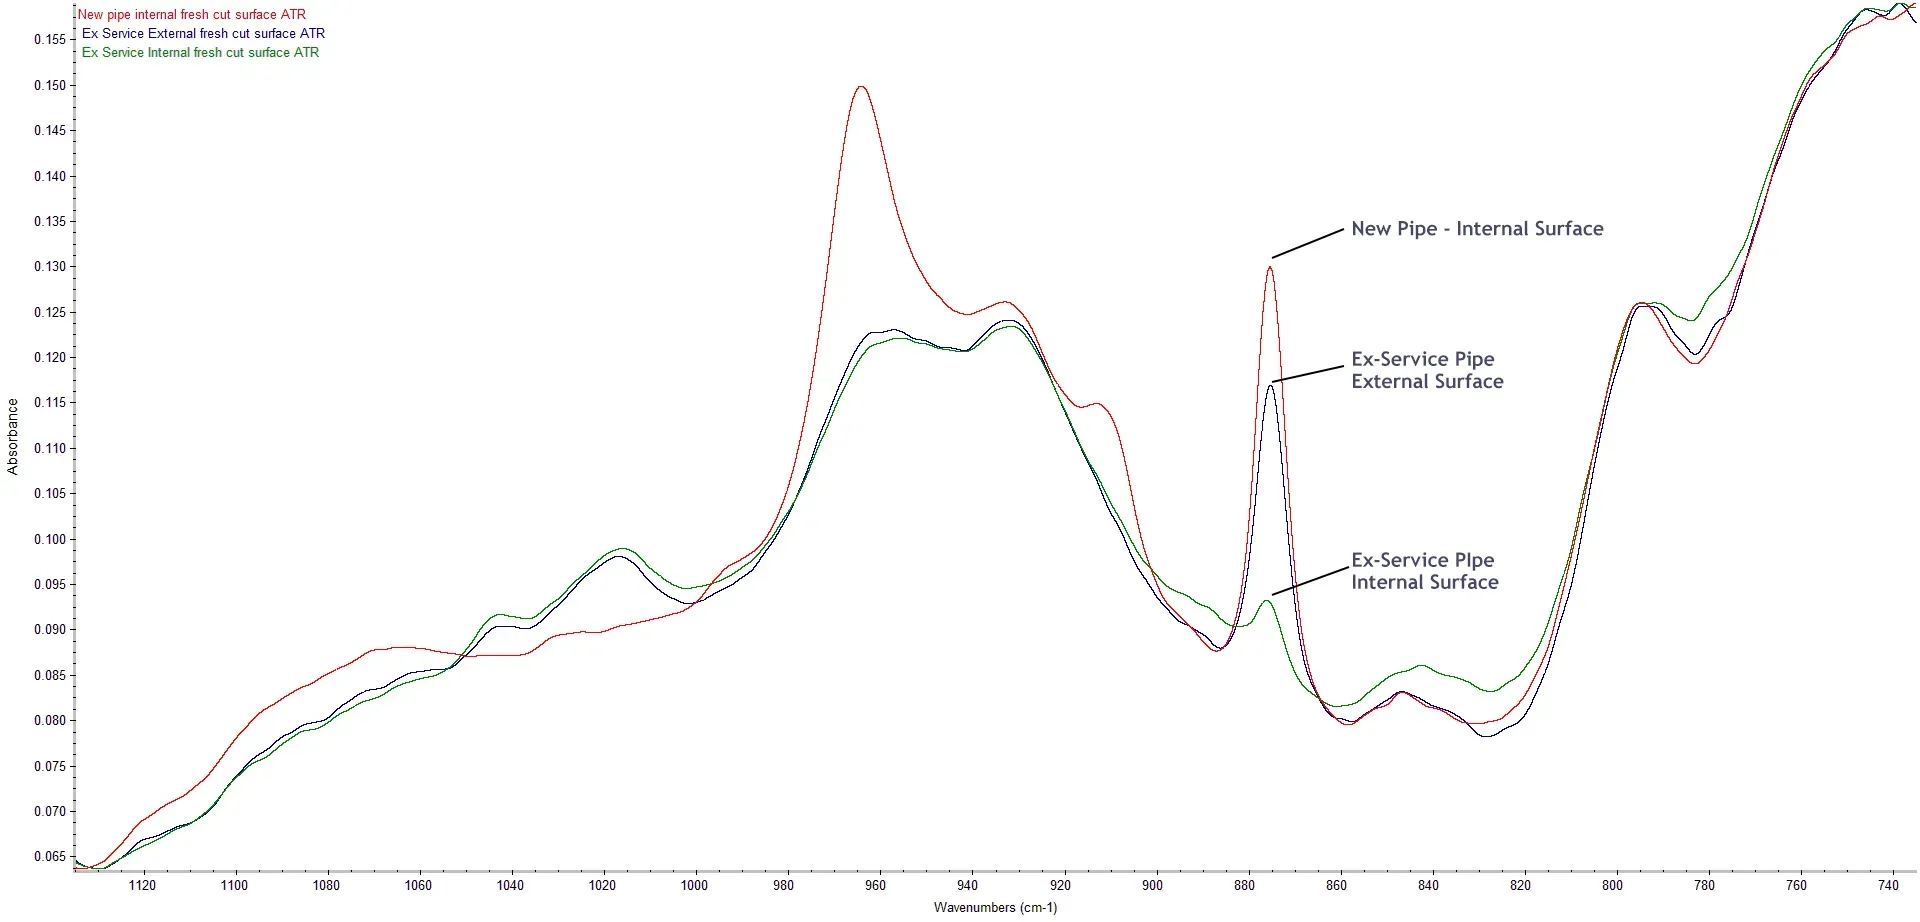
Comparison of butadiene and calcium carbonate peaks in Ex-Service Samples
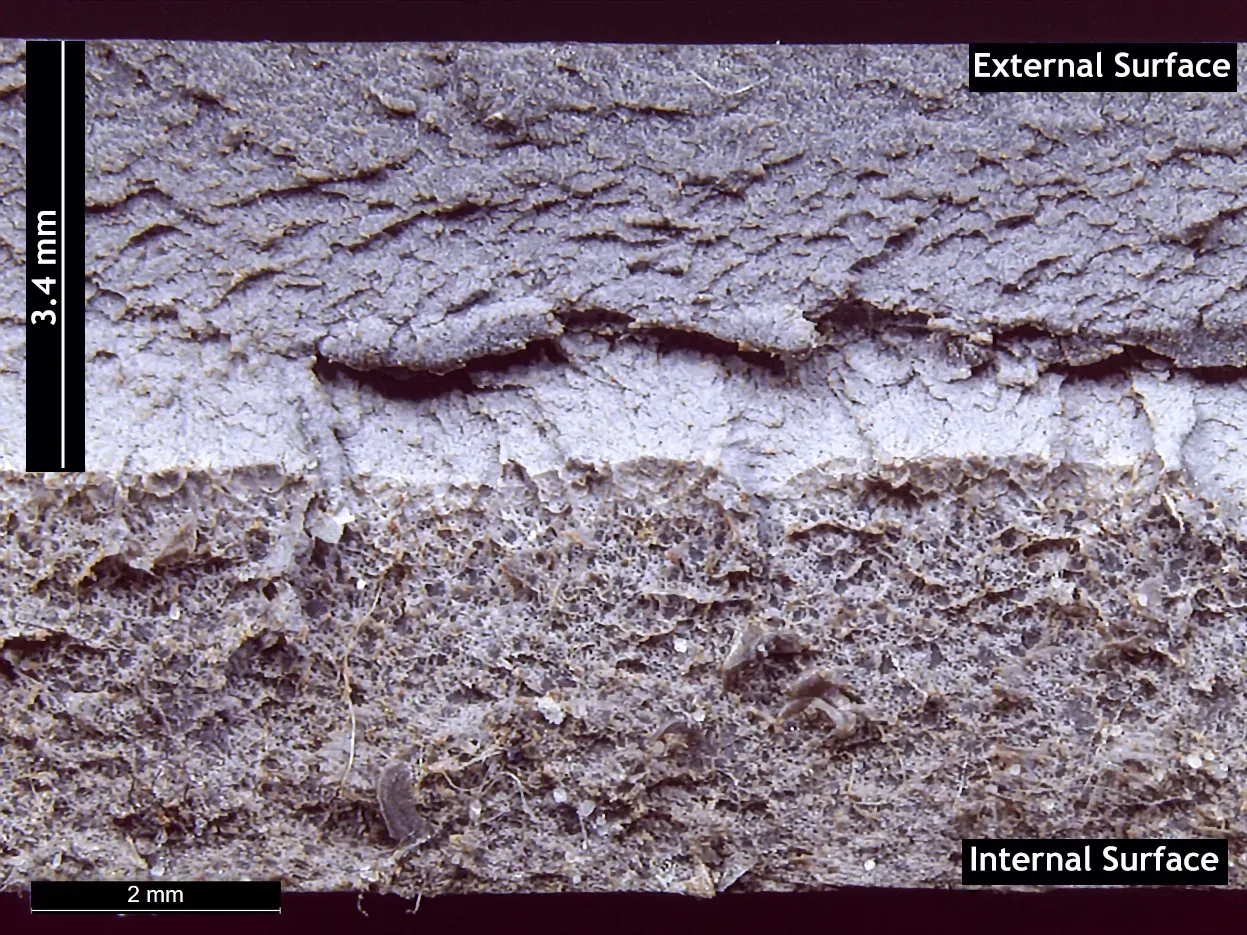
inspection of the fracture surface of an ex-service pipe with an optical microscope, showed two distinct surface structures with the outer 3.4 mm of pipe having a solid appearance whilst the inner material had a foamed/voided appearance.
New Paragraph
The butadiene absorption band at 912 cm-1 is missing from the spectra for material from both the internal and external surfaces of the of the ex-service samples and the 965cm-1 peak is further reduced relative to levels in the new pipe. This indicates that the butadiene in the samples has been degraded throughout the sample thickness.
inspection of the fracture surface of an ex-service pipe with an optical microscope, showed two distinct surface structures with the outer 3.4 mm of pipe having a solid appearance whilst the inner material had a foamed/voided appearance.